

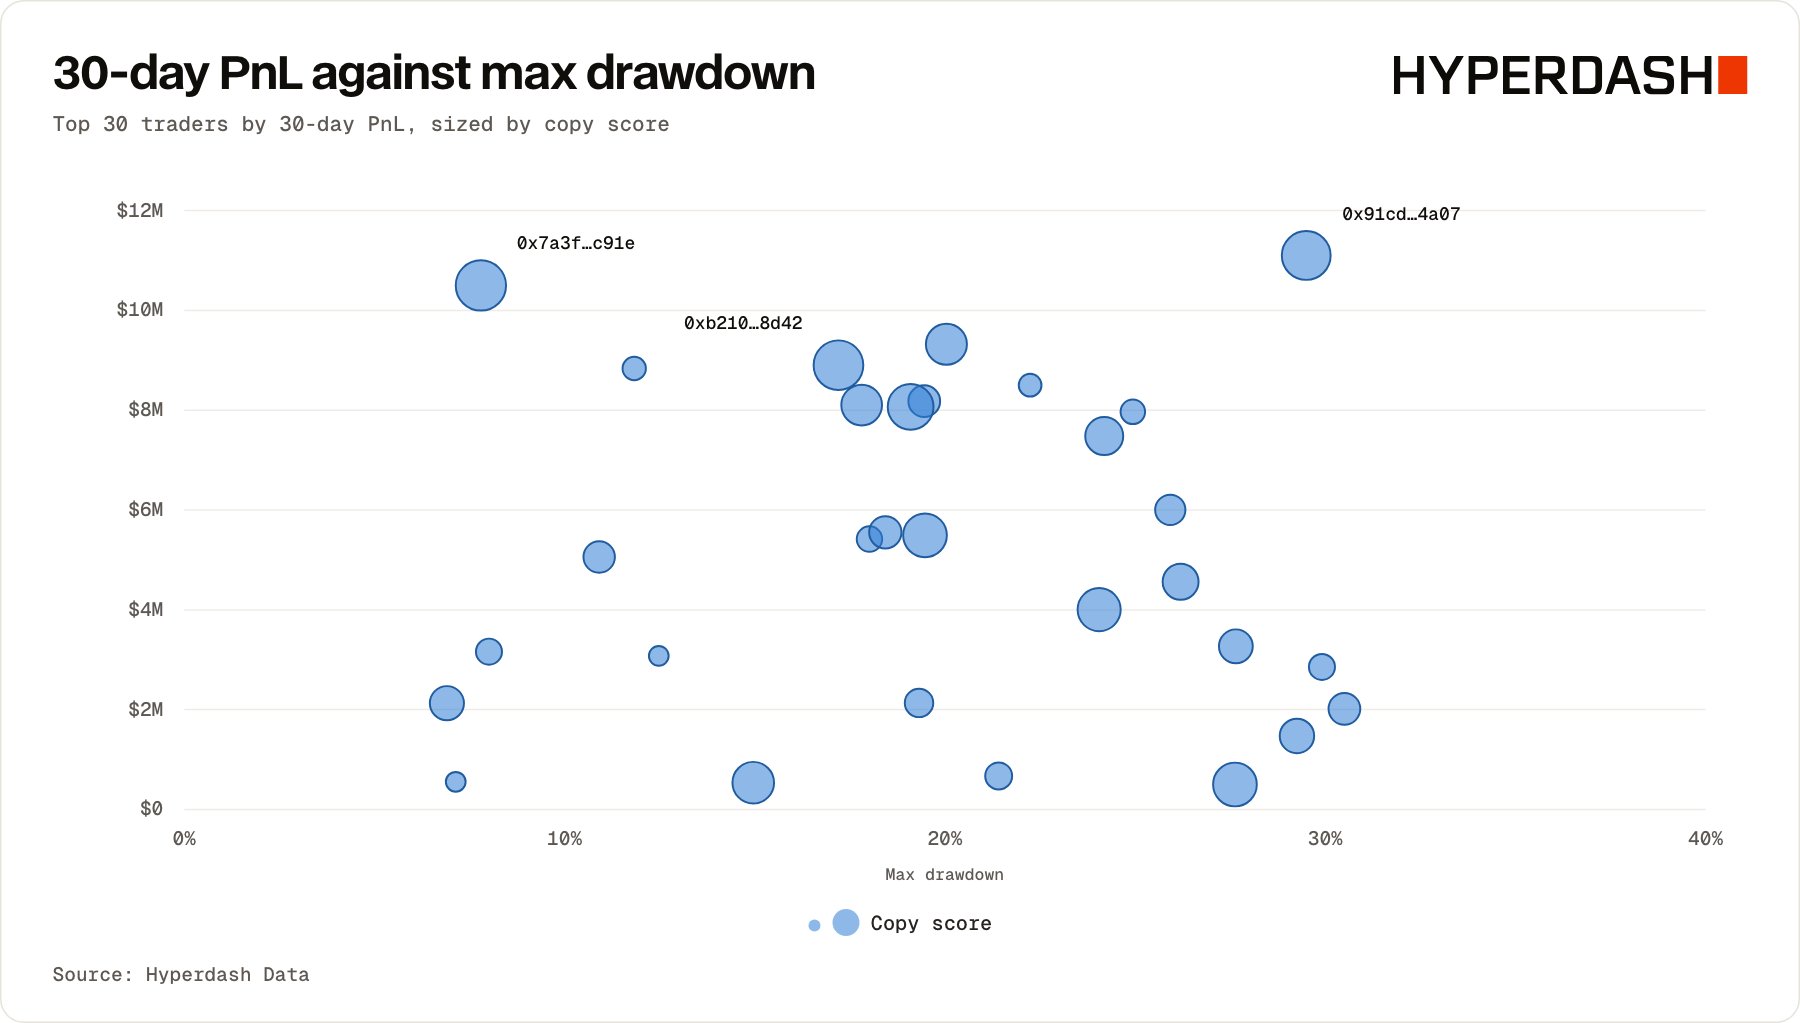
What you get: a ranked list of the top traders by 30-day PnL with their copy score, Sharpe ratio and max drawdown, with PnL plotted against drawdown.
Scatter chart of 30 traders: 30-day PnL against max drawdown, each dot sized by copy score.
Ask your agent: paste this prompt into an AI chat connected to the MCP server, or into a command-line coding agent such as Claude Code or Codex, with your API key exported.
Optional: add this line to get the results as an interactive dashboard.

API calls

Set your key and the values the calls use first:
1

List the top traders

Sorted by 30-day PnL. Each row carries copy score, 30-day Sharpe and max drawdown.
2

Break down a copy score

The factors behind one trader’s score.
3

Check longer-term risk

Sharpe and Sortino over 30 to 365 days, max drawdown over 7 to 365 days.

View more recipes